
Definition
TTM Gross Retention (Trailing Twelve Months Gross Retention), at a specific point in time (for example, at the end of June 2025), measures which portion of ARR from 12 months ago (in this example, at the end of June 2024) has been retained over those 12 months. Formula is:- BOP (Beginning of Period) = ARR produced 12 months ago from customers who were active 12 months ago
- Δ = Total ARR lost by those same customers over the 12-month window (downsells + churns/breaks, no upsells)
An example
Here is an example of TTM Gross Retention. You can also download the source file: TTM Gross Retention Example.xlsx.
| Customer | June 2024 ARR | June 2025 ARR | ARR Change | Is ARR Change included in Δ? |
|---|---|---|---|---|
| A | $100 | $150 | +$50 upsell | ❌ No (it’s an upsell) |
| B | $100 | $100 | $0 stable | - |
| C | $100 | $80 | -$20 downsell | ✅ Yes (it’s a downsell) |
| D | $100 | $0 | -$100 churn/break | ✅ Yes (it’s a churn, or a break*) |
| E | $0 (joined Jan 2025) | $120 | +$120 new | ❌ No (the customer was not there in June 2024) |
| Totals | $400 | $450 |
* For customer D, June 2025 ARR is $0. Its -$100 ARR loss is counted as a churn if the customer never pays again after June 2025, and a break if the customer resumes paying later.
Calculation:Optionality around TTM Gross Retention
Downward ARR movements can be of three kinds:- downsells (customers reduce their revenue)
- churns (customers leave permanently)
- breaks (customers drop to $0 ARR temporarily, but will resume paying at some future point in time)
By default, Break ARR is counted as part of Churn ARR. If you choose Isolate
Break ARR when generating a waterfall, breaks are tracked separately.
Approximate Method vs. Exact Method
Exact computation of TTM Retention requires looking at two 12-month apart columns of a Revenue Input Table recording customer-level data. Some analysts use a quicker approximate method to compute a TTM Gross Retention rate out of ARR movements recorded in an ARR waterfall. In practice, you compute Δ in the formula above by adding up the violet rectangle in the picture below, which records all downward monthly ARR movements that occurred during the 12-month window being considered.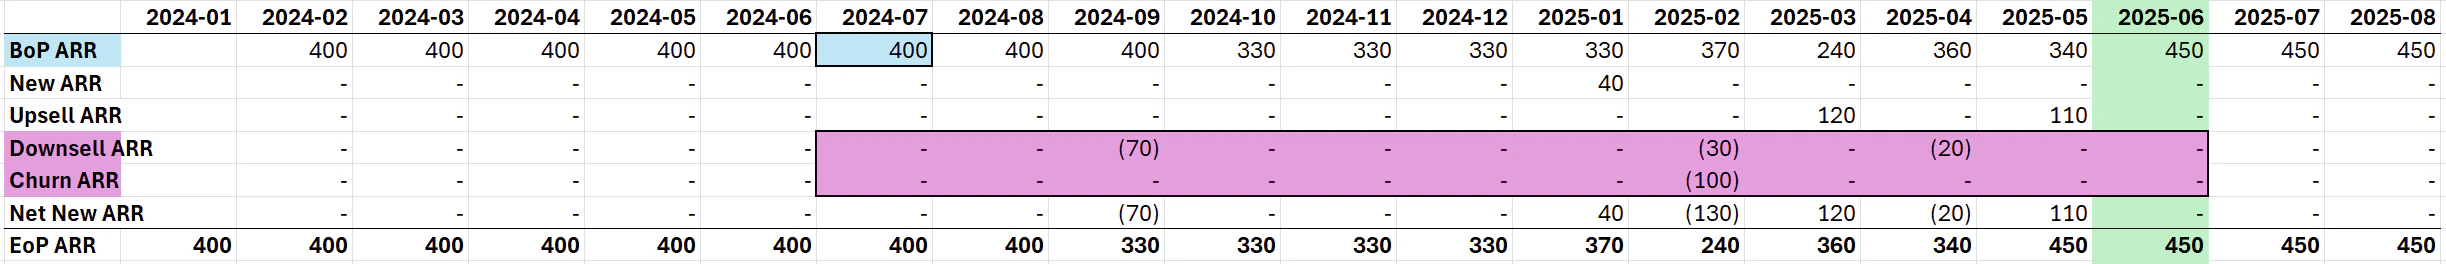
- The approximate method includes movements from all customers, including those who joined during the measurement period (June 2024 -> June 2025). That contaminates a metric that should only track customers active in June 2024. In our example, customer E’s -$30 downsell that occurred in Feb 2025 is unduly included by the approximate method.
- The approximate method sums monthly movements instead of comparing each eligible customer’s ARR at the start and end of the 12-month window. This can also negatively impact TTM Retention. For example, customer A’s -$70 downsell that occurred in Sep 2024 negatively affects approximate TTM Gross Retention, even if it is canceled by the +$120 upsell that occurred in Mar 2025, whereas the exact method for TTM Gross Retention correctly considers customer A as 100% retained by comparing its June 2024 ARR and June 2025 ARR.
When Approximate Method Works
The approximate method can still be acceptably accurate when both conditions below (corresponding to the two biases listed above) hold:- The contribution of recently acquired customers to ARR movements is negligible. In practice, this happens when new customer acquisition during the period is low, or when newly acquired customers have small movements compared to the other ones, so that most downsells/breaks/churns observed during the 12-month window are attributable to customers who were already producing revenue at the beginning of such time window.
- Customers do not have strong fluctuation patterns (for example, frequent downsells offset by later upsells, or breaks followed by reactivations).