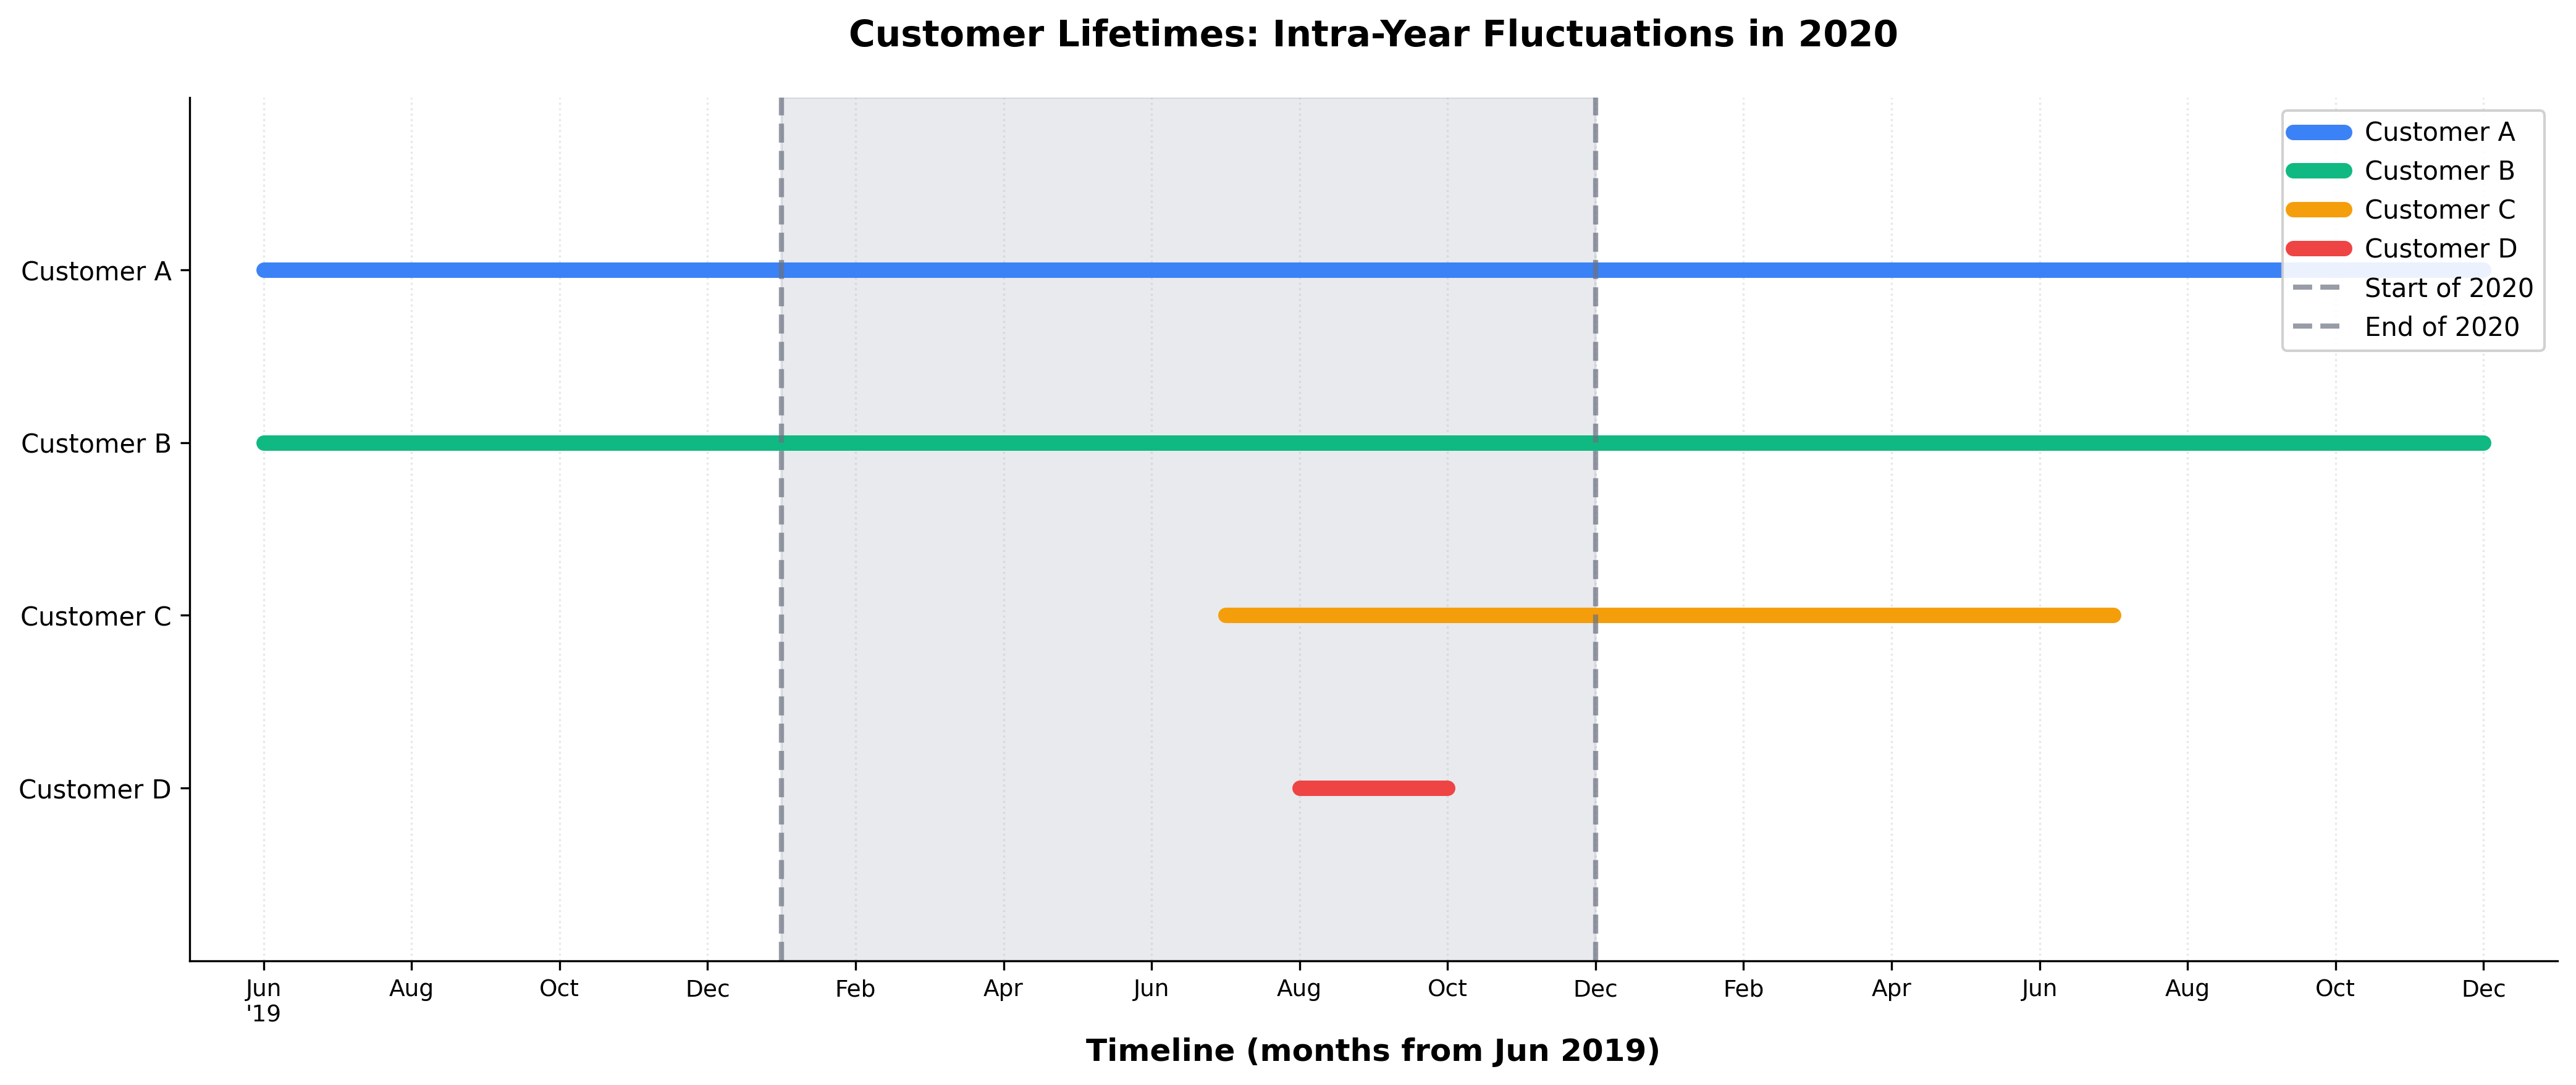
- Customer A subscribes in Jun ‘19, and remains a customer thereafter.
- Customer B subscribes in Jun ‘19, and remains a customer thereafter.
- Customer C starts in Jul ‘20, but stops in Jul ‘21.
- Customer D starts in Aug ‘20, but stops in Oct ‘20.
- Answer A. During 2020, two customers subscribed (C and D), and one customer churned (D): so 2020 New ARR is $200, and 2020 Churn ARR is $100.
- Answer B. At the beginning of 2020, two customers were there (A and B); at the end of 2020, A and B are still there, and a new customer joined (C): so there was no churn (both A and B are still customers), and there is a $100 New ARR.
| New ARR | Churn ARR | |
|---|---|---|
| Answer A | $200 | $100 |
| Answer B | $100 | $0 |
- You first produce a revenue input table displaying the data above.
- You generate a monthly waterfall.
- You aggregate to a yearly waterfall:
- To obtain Answer A, you include intra-year fluctuations. In this case, Dealbase adds up all monthly ARR movements occurred during year 2020 to achieve 2020’s New, Upsell, Downsell, and Churn ARR figures.
- To obtain Answer B, you exclude intra-year fluctuations. In this case, Dealbase takes two snapshots of the customer base at the beginning and at the end of 2020 (columns Dec-19 and Dec-20 of the Revenue Input Table), and determines which Dec-20 customers are new (meaning they were not there in Dec-19), which Dec-19 customers have churned, how much they have increased (upsell) or decreased (downsell) their ARR compared to Dec-19.
How to Toggle This Option in Dealbase
You can control whether to include or exclude intra-year fluctuations in your waterfall computations directly from the Dealbase interface: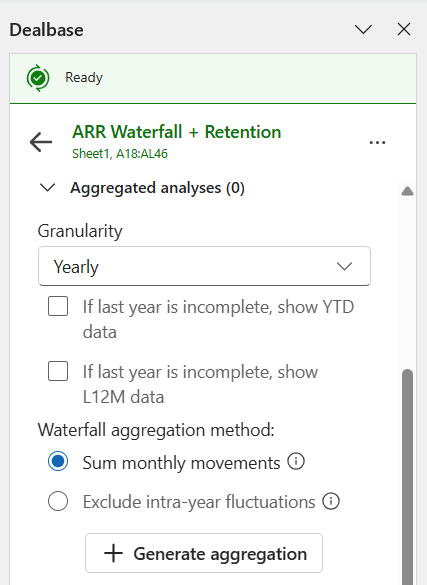
When to use Method A vs. Method B
Method A has the privilege of showing all movements that occurred within the period. In the provided example, it is capable of capturing the phenomenon of Customer D subscribing and then unsubscribing after a few months — while, if one only looks at Method B’s churn figures for 2020, it may seem that there’s no churn rate in the business, hence no unsatisfied customer. Method B is better suited for volume-based businesses. Suppose you have a volume-based business in which a customer each month upsells and downsells, like in the example below.| Month | Jan | Feb | Mar | Apr | May | Jun | Jul | Aug | Sep | Oct | Nov | Dec |
|---|---|---|---|---|---|---|---|---|---|---|---|---|
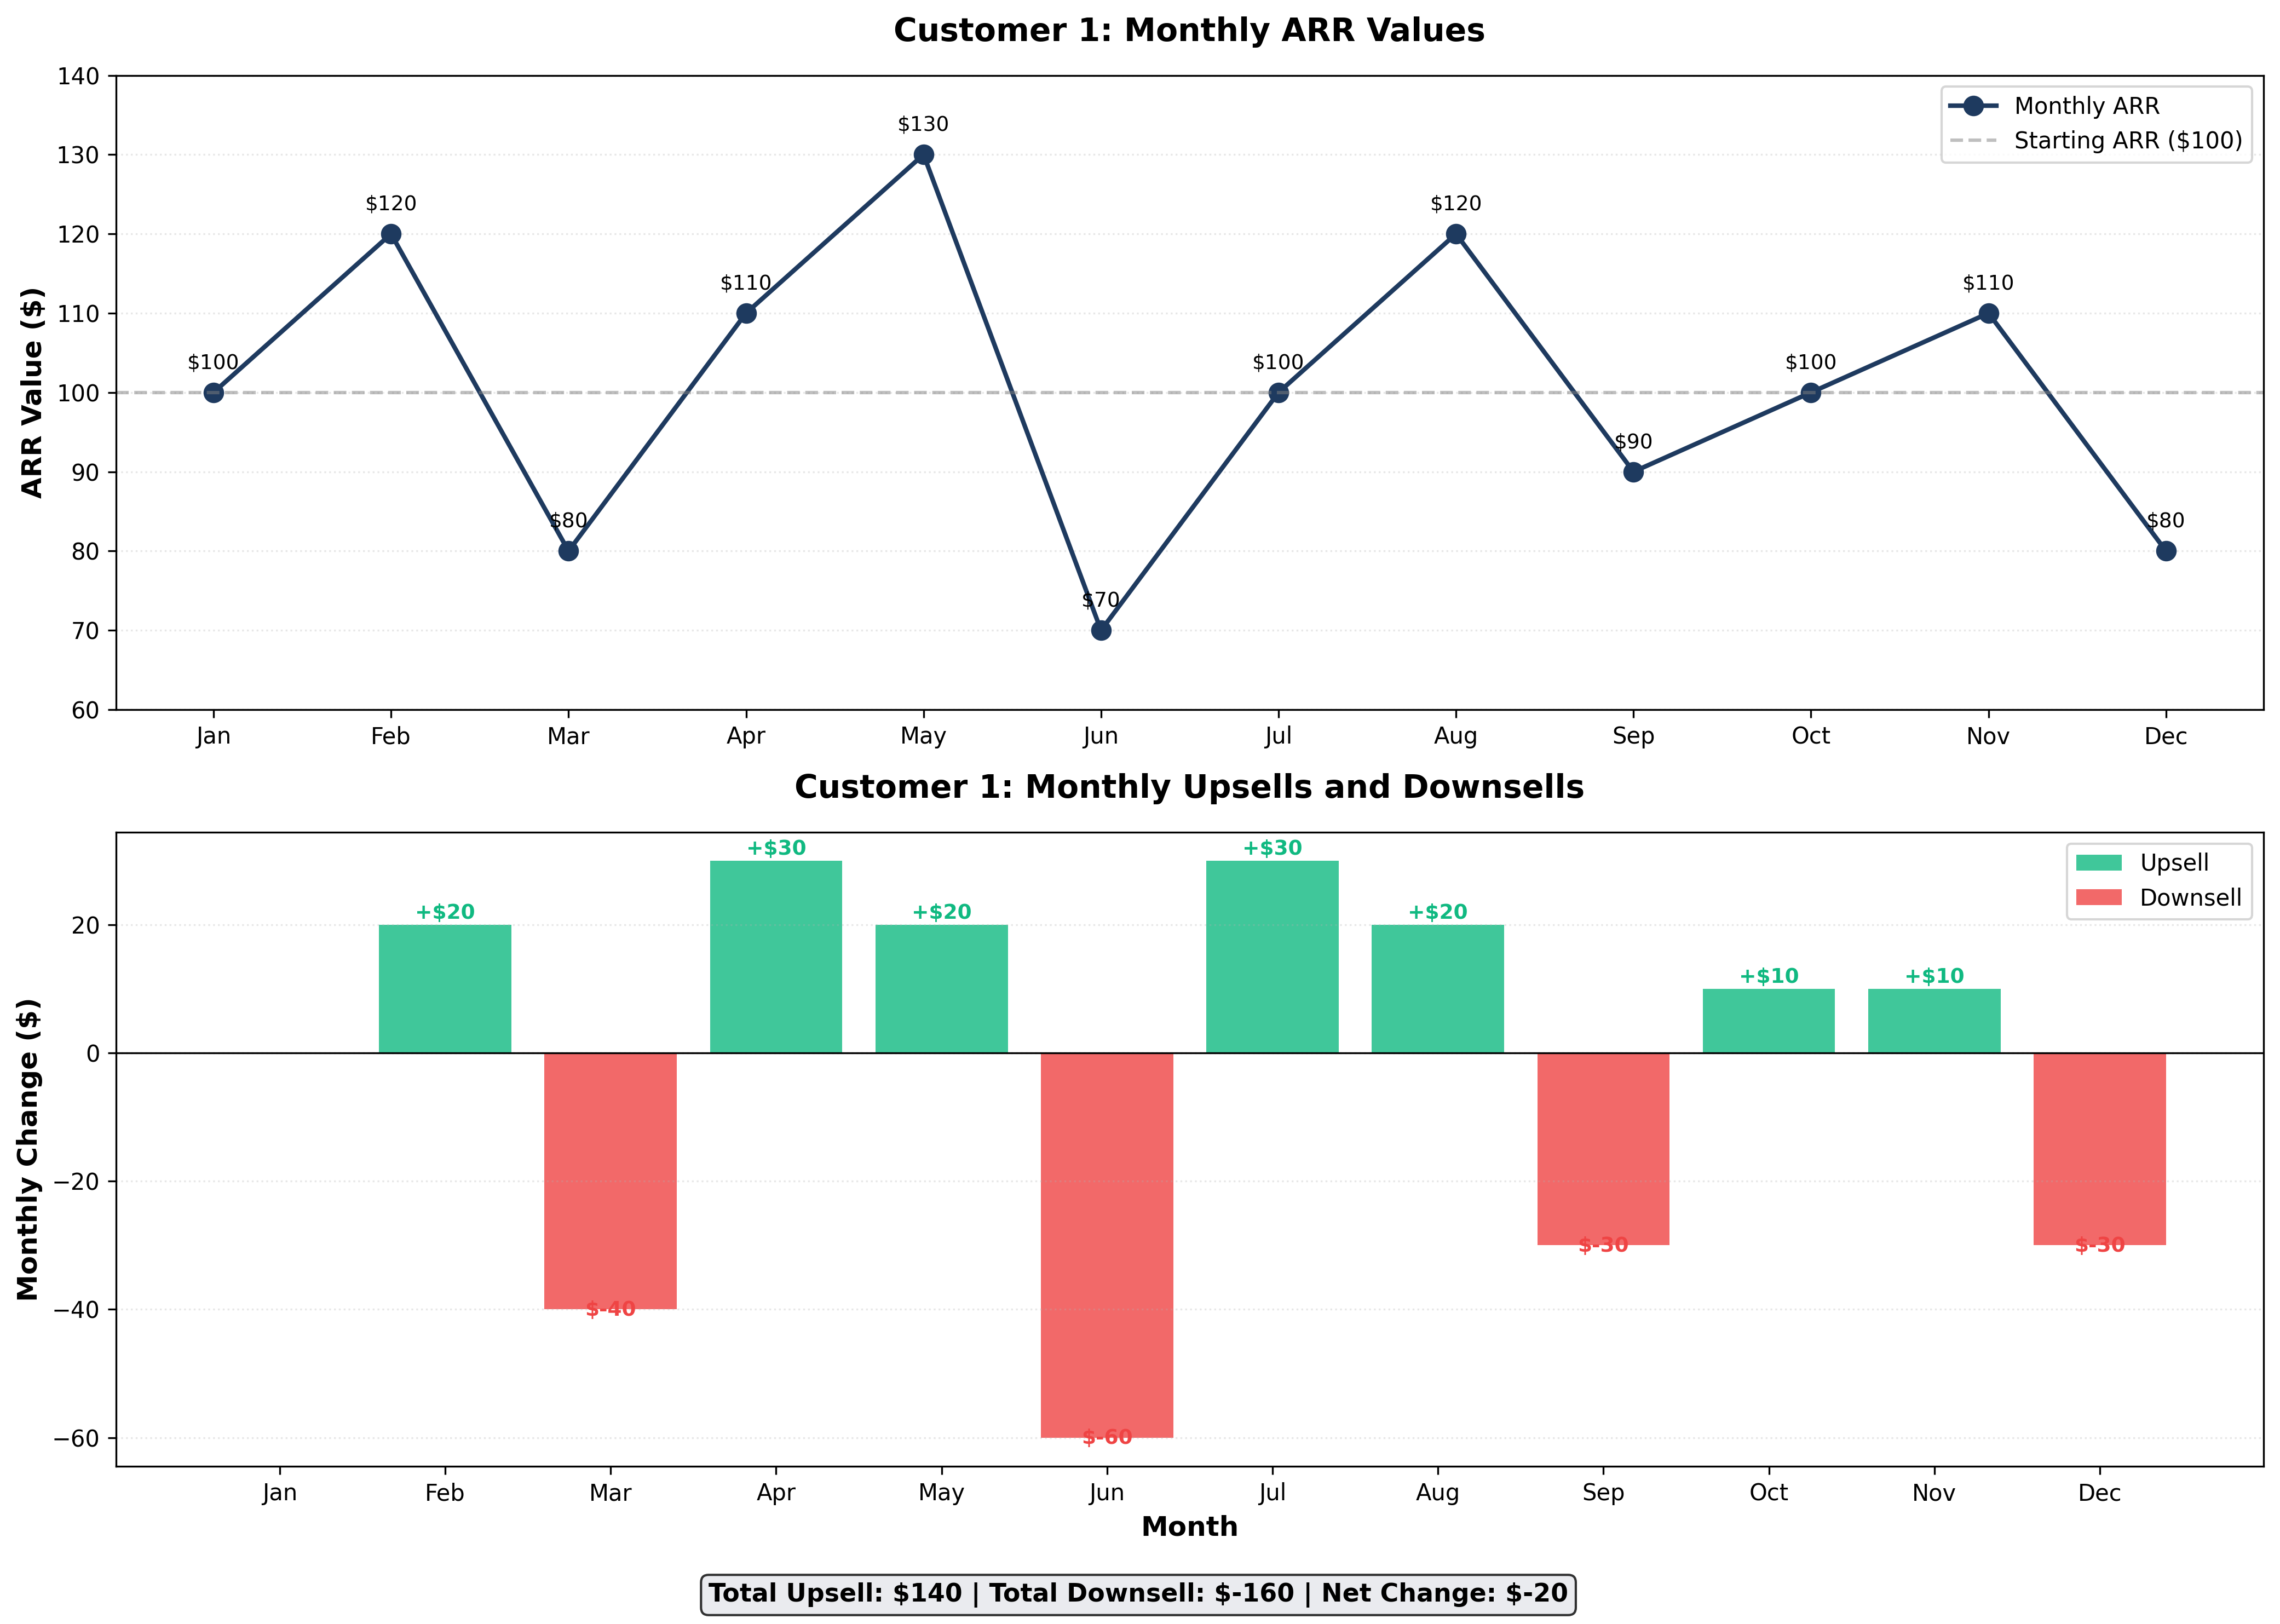
| Customer 1 | $100 | $120 | $80 | $110 | $130 | $70 | $100 | $120 | $90 | $100 | $110 | $80 |
Understanding Method A: Monthly Fluctuations Breakdown
If one computes Customer 1’s upsell in 2020 using Method A, one would say that this $100/month customer has undergone a $140 upsell and a $160 downsell. Here’s how these totals are calculated: Monthly Upsells:- Feb: +$20 (from $100 to $120)
- Apr: +$30 (from $80 to $110)
- May: +$20 (from $110 to $130)
- Jul: +$30 (from $70 to $100)
- Aug: +$20 (from $100 to $120)
- Oct: +$10 (from $90 to $100)
- Nov: +$10 (from $100 to $110)
- Mar: -$40 (from $120 to $80)
- Jun: -$60 (from $130 to $70)
- Sep: -$30 (from $120 to $90)
- Dec: -$30 (from $110 to $80)